There’s a lot you can do with Google Analytics, but a lot of it is hidden behind the scenes. Sure, the Google Analytics graphical interface allows you to setup advanced filters, track secondary dimensions, and compare date ranges. That’s all fine and dandy, but if you’re like me, you need some tighter control over how you pull your data. Enter the Google Analytics API.
I’m going to show you a trick that we use here at Elliance everyday. I’m sure Google is aware that people employ this tool in this way, but it’s not openly advertised. Think of this tutorial as an early Christmas present from your friends at Elliance!
The Google Analytics Query Explorer
This tool was introduced for developers who are building their own custom API applications. Google wanted to provide a way for people to test out API queries through a sandbox-like page, to make it easier to debug complex API queries. But you can also use the Query Explorer for accessing raw data without even entering Google Analytics!
Let’s say a client asks you: What organic search keywords (and how many) were used to arrive on our About page in November, and from what cities? Oh, and we only care about people outside of Montana who typed a non-branded phrase and used a mobile device. No prob, Bob.
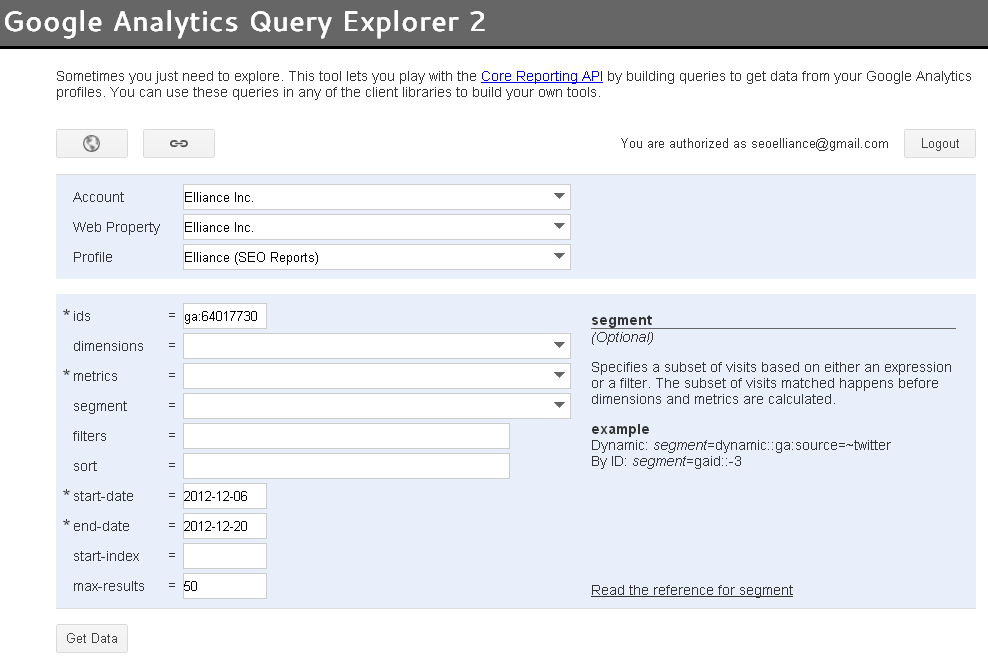
Step 1. Visit http://ga-dev-tools.appspot.com/explorer/?csw=1
Step 2. Click Authorize Access and sign in to your Google Analytics account.
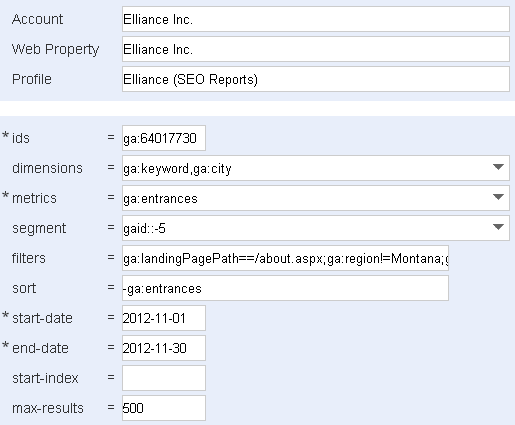
Step 3. Your Analytics accounts should pre-populate the “Account” field. Select the relevant Account, Web Property, and Profile.
Step 4. Click the metrics tab and select ga:entrances from the drop-down menu. Metrics are the “number” portion of your data. In this example, we want to know the number of entrances, because entrances reflect the number of times keywords drove traffic to (or “entered”) the site. Do not select ga:visitors for this example. Likewise, you do not want to select ga:visits — that metric counts the number of separate pages visited in a session. You can select up to 10 metrics!
Step 5. Click the dimensions tab. Dimensions are the “thing” you want to count. You can select up to 7 dimensions. In this example, select ga:keyword and ga:city. The two dimensions will be separated by a comma.
Step 6. Under Segment, select “Non-paid Search Traffic”. After selection, this field will appear as gaid::-5.
Step 7. Now the fun begins. Filters! This is where the real power of the Query Explorer shines. For more information about how to write complex filters, check out the Filters Section in the Reference Guide.
Type ga:landingPagePath==/about.aspx;ga:region!=Montana;ga:keyword!@elliance;ga:isMobile==Yes
== equals exactly
=@ contains
!= does not equal
!@ does not contain
Filters are separated by ; (for and) and , (for or). In cases where you use both, or takes precedence.
Step 8. Under Sort, type -ga:entrances (don’t forget the minus sign). This sorts our data by entrances in descending order.
Step 9. Pick the appropriate date range; click the fields, and use the calendar popups to select 2012-11-01 and 2012-11-30.
Step 10. Leave start-index blank and knock max-results up to 500, just in case.
Step 11. Click Get Data!
Voila! The results you’ll get are in a simple HTML table. You can select this data, and copy-paste it into Excel. The columns should transfer to Excel automatically! (If not, copy the table into Notepad first, then into Excel.)
That’s it! Now you can dig into the heart of Google Analytics and write some pretty complex queries. Merry Christmas!


Comments