| Jan 7, 2016
Infographics are still hot.
Like we said in 2012, infographics are trendy, and for good reason.
An infographic is a simplified visual representation of something that could be said in a longer, more complex story.
Humans are creatures of habit. We’ve been conditioned by major brands like Instagram, Snapchat and Vine to prefer our content in bite size portions, mere seconds at a time. Our time is valuable – which is why we love infographics so much.
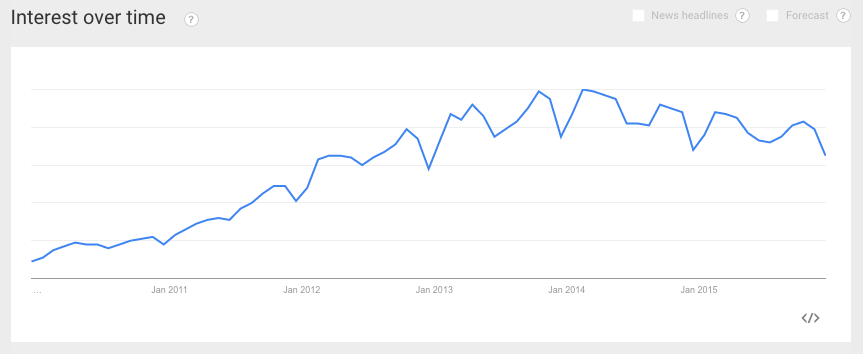
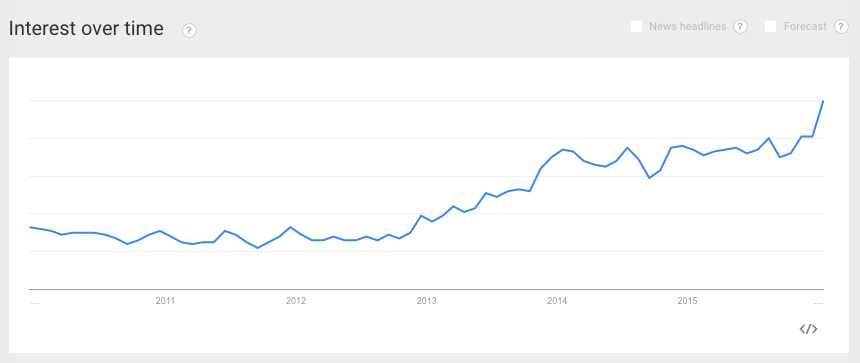
Curious about the explosion of infographic use over the past few years, I went to Google Trends to see what they had to say about user search habits. You might be surprised to see that our interest in infographics has been gaining momentum since 2010, much like our interest in funny cat videos.
Trendiness of search term “Infographics” from 2010-2015
Trendiness of search term “Funny Cat Videos” from 2010-2015
Cats and kittens aside, a well done infographics can do more than just inform. Due to their share-friendly nature, infographics are a great tool for increasing traffic to your website or blog. KISSmetrics boasts that in two years time, they were able to generate over 2.5 million visitors from just 47 infographics. Holy meow!
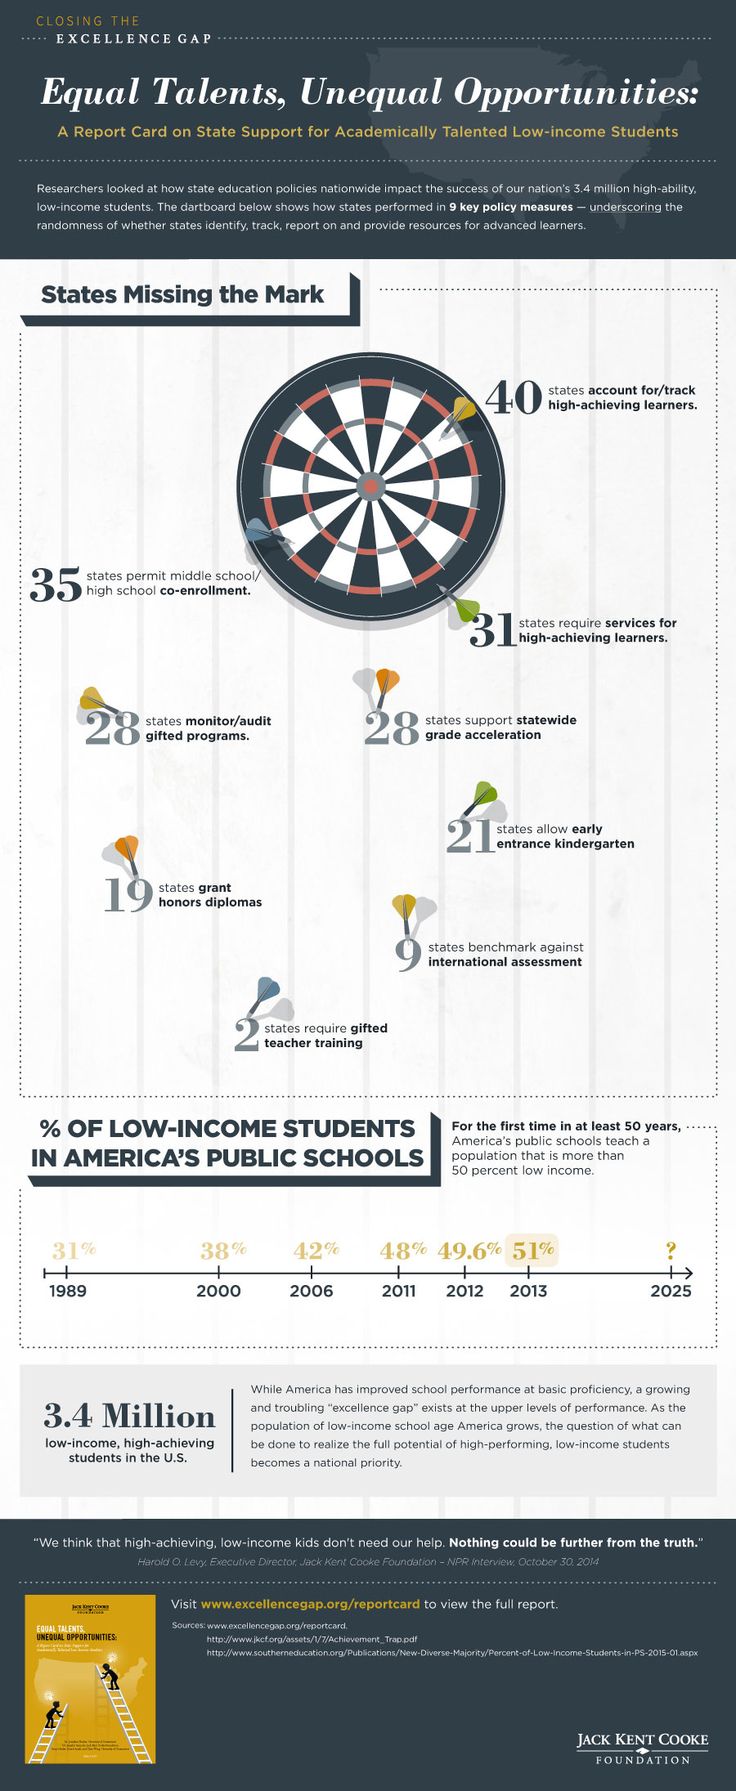
Below is an example of an infographic we made for our client The Jack Kent Cooke Foundation. (click the image to expand) Want more? Visit our Pinterest page.

