
| Mar 9, 2012
Who are your mobile visitors? Ask your web analytics.
By now, you’ve realized you need a mobile presence. Or maybe you already have one, or are trying to figure out whether it’s really working for you. Is it time for phase two? Your current state aside, chances are you’ve got mobile on the mind.
But how do you know what your visitors want?
It’s not rocket science. In fact, you have a lot of data and insights stockpiled already.
Over the next few weeks, I’ll share some details with you about how to conduct your own DIY user research to better plan for your next mobile venture.
This week, we’ll start by using website analytics. After that, we’ll explore interviews and surveys…you know, talking to real people.
Why use analytics?
Almost everyone has Google Analytics or some other web analytics package installed. Even if you haven’t been actively using it, the tool has. It’s been busy collecting valuable usage data.
There are a few benefits to using web analytics data to inform your mobile plans. To name a few, it:
- Provides an enormous sample size
- Records actual visitor behavior
- Is non-intrusive to your research subjects (aka busy humans)
- Is free
With this data, we can find out:
- How many people visit via mobile devices
- The most popular mobile devices and operating systems (OS) used to browse your site
- Where your mobile audience lives
- The most popular content
For the following steps, we’ll assume you have Google Analytics tracking in place, and are looking at your full “desktop” site. I like to set my timeframe to the most recent quarter because new smartphone users come online rather frequently. If you already have a mobile solution with tracking, you’ll have even more data to sort.
Step 1: How many people visit your site via mobile device?
In Google Analytics, go to Audience > Mobile > Overview
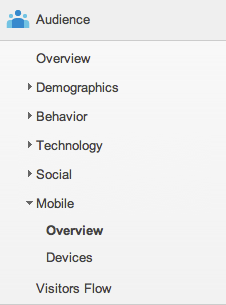
To be honest, this actual number probably doesn’t matter unless you have access to valid benchmarking data from your competitive set. But, you can look back in time and compare last year’s mobile demand to this year’s and notice how it has grown. This makes a convincing PowerPoint slide!
Step 2: What devices do your visitors use?
In Google Analytics, go to Audience > Mobile > Devices
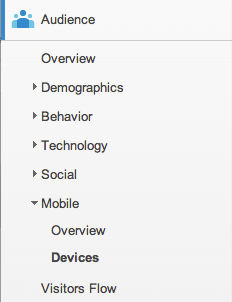
In addition to the default Mobile Device Info, browse through the other primary dimensions. The Operating System dimension succinctly tells you whether people are on iPhones, Blackberries or Droids. Check out Screen Resolution and Mobile Input Selector too, for future design considerations.
Once you’ve explored, you’ll know what the primary mobile devices are, and from here you can draw your own conclusions. For example, if you’re seeing a significant number of people on iPads or folks not using touch screens, you’ll know to factor these audiences into your plans.
Step 3: Where are these mobile visitors located?
In Google Analytics, go to Audience > Mobile > Devices > Map Overlay
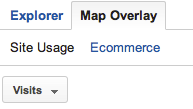
Your visitors’ locations may be important. For example, if you’re a higher ed institution wondering which of your audiences use mobile the most, you can analyze your data based on location: on campus, or from around the country. This can help you determine whether visitors are current students, faculty, and staff, or prospective students and alumni. If you’re a business, you may be concerned with supporting international visitors via mobile.
To find even more location information, switch your secondary dimension to something like Operating System. Now you can see where the 5 people using Windows Phones to browse your site live. Of course, a dimension like Visitors > Language may be more important.
Step 4: What is your site’s most popular mobile content?
In Google Analytics, go to Content > Site Content > Pages
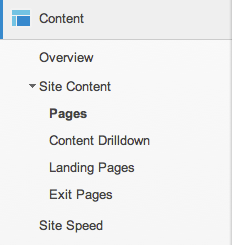
Then go up to Advanced Segments > (scroll a bit) Mobile Traffic checkbox > Apply
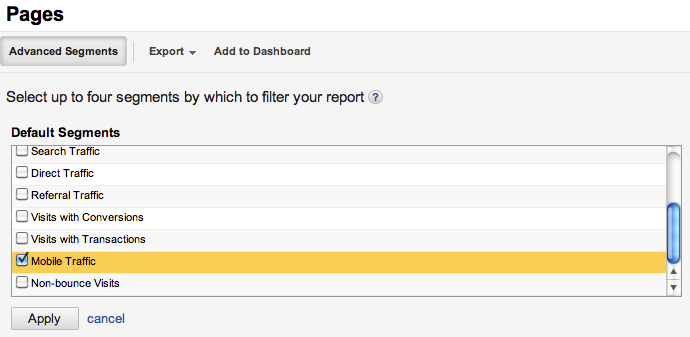
(FYI: Shortly after you read this, you will forget where the Mobile Traffic checkbox is. Write it down on a sticky note!)
This will give you content ideas for your mobile planning. You might look at the results and see that a wide array of pages (or even every page of your site) is popular to someone on mobile. This could cause you to look into a full-site mobile solution or responsive web design. Or, you might be able to make inferences about your biggest (or smallest) mobile audiences, and what kind of content they access most.
This could even give you ideas for future mobile apps—for example, I’m looking at analytics from a higher education site. Here, I can see that current students are really interested in logging into the password-protected intranet via their phone. Maybe I could find out through more tracking (or other methods) what they are doing there. Maybe it’s their schedules, grades are being posted…or even a lunch menu. Paired with knowledge about popular devices, you have a lot of data to start an interesting conversation.
Step 5: Take it further
The Advanced Segment > Mobile Traffic option is very valuable—you can use it virtually everywhere in Google Analytics to dig deeper into your mobile analytics. This article just scratches the surface of what you can do.
Or, if you have more (or better!) ideas about how to use Google Analytics to explore mobile data, let me know in the comments.